
What a Fund Fact Sheet Is - and Isn't
A fund fact sheet is a standardized summary document produced by a fund manager, typically updated monthly or quarterly. It condenses a fund's strategy, holdings, costs, and historical performance into a format designed for quick review. Most retail investment platforms make these freely available for every fund they offer.
What it is not is a comprehensive prospectus. The full legal prospectus - a much longer document - contains complete risk disclosures, redemption terms, and regulatory detail. The fact sheet is a navigational tool; think of it as the dashboard rather than the engine manual. If you're new to evaluating investments, our grounded guide for first-time investors provides useful framing before diving into fund-level documents.
What you will need
How to Work Through a Fact Sheet Step by Step
Fact sheets reward a structured read. Jumping straight to the performance chart is the most common mistake - it strips a number of context that only the surrounding information provides. The steps below walk you through a logical sequence: objective first, costs and holdings next, performance and risk last.
Fund fact sheet (PDF or web version)
The primary document you will be reading and interpreting throughout this process.
Benchmark index reference
Used to compare the fund's performance against its stated market benchmark (e.g., S&P 500).
Expense ratio comparison tool or fund screener
Helps you contextualise a fund's cost relative to peers in the same category.
Read the fund objective and strategy first
Before looking at any numbers, locate the fund's stated investment objective - usually a short paragraph near the top of the fact sheet. This tells you what the fund is trying to achieve: growth, income, capital preservation, or a blend. Confirm it matches your own goal. A high-growth equity fund is structurally different from a conservative bond fund, regardless of recent returns.
Identify the asset allocation and top holdings
Most fact sheets include a portfolio breakdown by asset class (equities, bonds, cash) and a list of the top 10 holdings by weight. Use this to understand what you actually own. A fund labelled 'balanced' might hold 70% equities - which matters if you expected something more conservative. Check whether the top holdings are concentrated in a few names or broadly spread.
Locate and understand the expense ratio
The expense ratio (sometimes shown as the Ongoing Charge Figure, or OCF) is the annual cost of holding the fund, expressed as a percentage of your investment. A fund with a 0.75% expense ratio costs $7.50 per year for every $1,000 invested - before any market movement. This fee is deducted from fund assets, not billed separately, so it quietly reduces your net return every year. Lower costs compound favorably over time.
Interpret performance figures in context
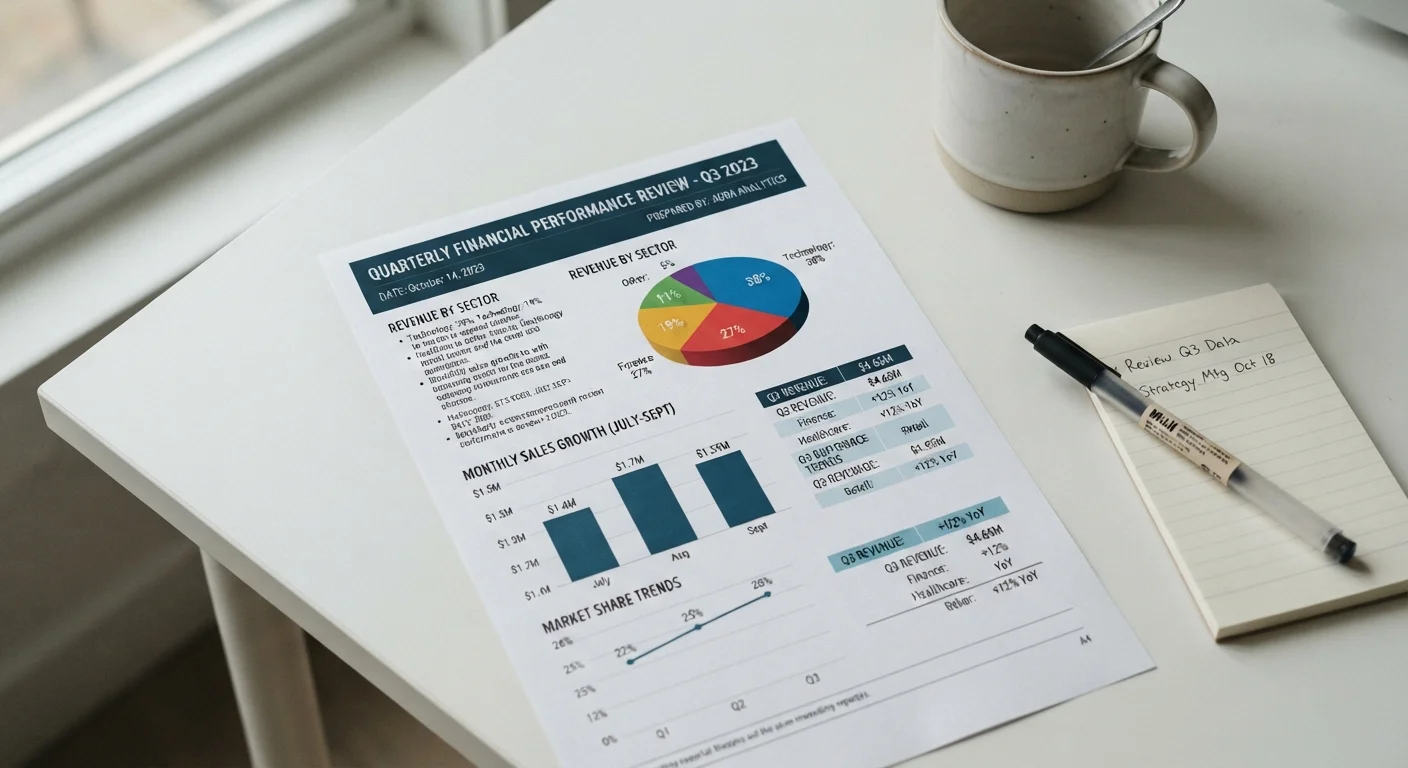
Performance tables typically show returns over 1, 3, 5, and 10-year periods, alongside the benchmark return for the same periods. Compare the fund's return to its benchmark, not to the market generally. Also note: these are past returns. Regulatory disclosures on every fact sheet remind investors that past performance does not guarantee future results - a principle worth internalizing.
Check the risk metrics
Fact sheets commonly include at least one risk measure. Standard deviation shows how much the fund's returns have varied around its average - a higher number means bumpier performance. The Sharpe ratio measures return relative to the risk taken; a higher figure suggests better risk-adjusted performance. Some sheets also show a simple numeric risk rating (e.g., 1-7 scale under EU/UK disclosure frameworks). Use these alongside performance data, not instead of it.
Note the fund size and manager tenure
Fund size (assets under management, or AUM) can indicate stability - very small funds may face liquidity constraints or closure risk. Manager tenure matters for actively managed funds: if the current manager took over recently, the historical performance record may not reflect their decisions. For passive index funds, manager tenure is less relevant since the strategy is rules-based.
Build a Comparison Habit
Download fact sheets for two or three funds in the same category and read them side by side. Differences in expense ratios, benchmark choices, and sector weightings become far more visible in direct comparison than in isolation. This is especially useful when evaluating funds within a retirement account or brokerage portfolio.
For a deeper look at how cost structures differ between fund types, see our article on index funds versus actively managed funds.
Putting the Numbers to Work
Once you can read a fact sheet fluently, the real value lies in comparison. A single fund's expense ratio means little without knowing the range for similar funds. A 5-year return is only revealing when set beside the benchmark over the same period. Context transforms raw data into useful signal.
Fact sheets also flag what a fund won't do - geographic exclusions, sector limits, currency hedging policies. These constraints shape your actual exposure as much as the top holdings list does. Pair this document-level habit with the durable principles that underpin long-term investing and the numbers begin to tell a coherent story.
Fact Sheets Have a Publication Lag
Most fact sheets are updated monthly, meaning holdings and performance data may be several weeks old. Significant market events can alter a fund's positioning between publication dates. For time-sensitive decisions, check whether more current data is available directly from the fund provider or your brokerage platform.
This article is for general informational and educational purposes only and does not constitute personalised financial or investment advice. Consult a qualified, licensed financial adviser before making decisions based on your individual circumstances.